



Creative Economy in Asia-Pacific:
Identifying Development Pathways and Ideas for India
Amitendu Palit, Divya Murali
30 June 2026Summary
A ‘creative economy’ comprises economic activities drawing on cultural creativity and intellectual capital.[1] Its importance has increased significantly in the Asia-Pacific following the digital transformation of content production and its distribution. Regional economies are emphasising on the creative economy through various policy interventions. The emphasis is complemented by regional institutions like the Association of Southeast Asian Nations, Asia-Pacific Economic Cooperation and Asian Development Bank.
This paper studies various economic dimensions of creative sectors across a group of economies from the Asia-Pacific region. It identifies four key development trajectories emerging from the analysis: scale, Intellectual Property focus, measurement and hub approach in Indonesia, South Korea, Malaysia and Singapore. These experiences follow a detailed analysis of India’s disaggregated creative economy potential. The paper concludes with suggestions on appropriate public policy responses for advancing the creative sector.
Introduction
Effective policy intervention for a creative economy is constrained by shortcomings in measuring its size and scale. Asia-Pacific does not display a common regional framework in this regard. This is regardless of the United Nations Conference on Trade and Development (UNCTAD) and the United Nations Educational, Scientific and Cultural Organisation (UNESCO) having developed frameworks for measuring the creative economy in the early 2000s.[2] Barring limited examples like Malaysia and the Philippines, regional efforts to build statistical frameworks to measure a creative economy are not yet visible.
Notwithstanding the measurement limitations, this paper attempts to closely understand the regional experiences for developing creative economies and identify specific development pathways. The ostensible objective of the research is to draw relevant policy insights for application in India and some of its states that have great potential for developing as creative economy powerhouses.
The paper is divided into three sections. Section 1 illustrates the regional experience of the development of creative economies. Section 2 looks closely at four distinct development pathways. Section 3 explores the creative economy of India, followed by concluding thoughts.
Section 1: The Regional Experience
We look at a four-dimensional portrait of eight Asia-Pacific economies to study their creative economy sectors and identify distinct development pathways. The economies include China, Indonesia, Japan, Malaysia, the Philippines, Singapore, South Korea and Thailand. They are chosen on the basis of the availability of data and the strategic significance of the creative sector in their overall economies. While avoiding comparison, the effort is to identify how Asia-Pacific economies are developing creative sectors.
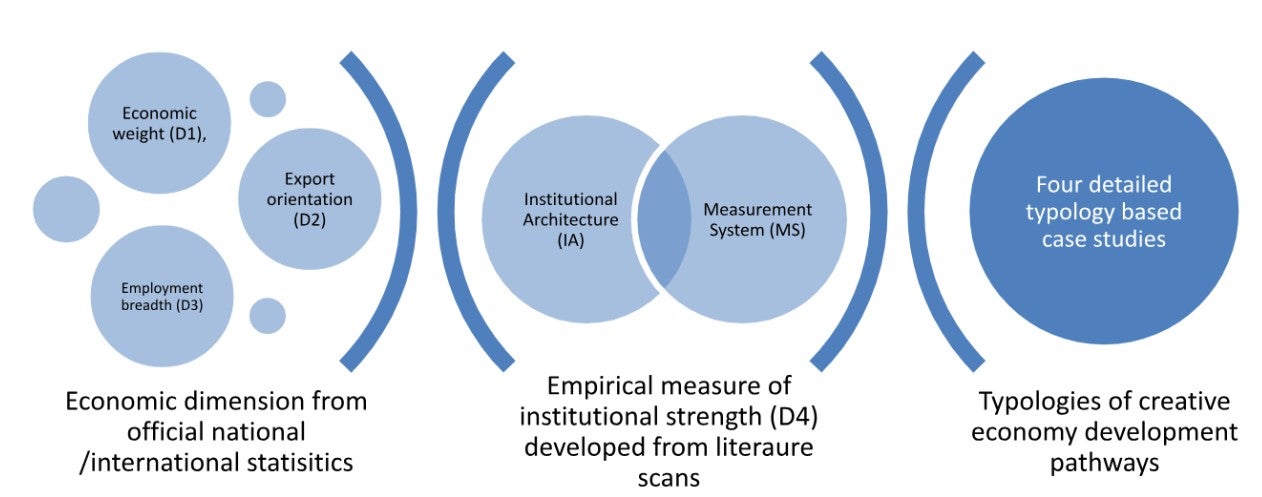
Figure 1: Design, Approach and Data
Source: Author’s own computation.
Economic indicators for the chosen economies are collected from national or UN statistics. We develop an empirical measure of institutional strength for the creative economy based on evidence from existing literature. The economic indicators and institutional scores are combined to understand the various approaches to creative sectors in these various economies through four dimensions. These are:
D1: Creative economy output as proportion of Gross Domestic Product (GDP).
D2: Creative economy exports as proportion of national exports.
D3: Creative economy employment as a proportion of total national employment.
D4: Institutional Strength – D4 is an exploratory parameter devised for assessing national institutional capacities for supporting creative sectors. It combines the Institutional Architecture (IA) and the Measurement System (MS) of each economy. IA broadly captures capacities to strategise a creative economy (cabinet-level policy agencies, cross-ministerial coordination, budgetary support), and MS reflects statistical capacities to measure the creative economy (satellite statistical accounts, alignment with United Nations (UN) measurement standards, availability of multi-year statistical data).
It is important to note data limitations determining the scope of the analysis and the outcomes. These largely stem from definitional differences of the creative economy[3] along with variations in the years for the availability of data among economies.
The results from empirical analysis are in Table 1, and the insights follow below.
Table 1: Creative economy parameters select Asia-Pacific economies
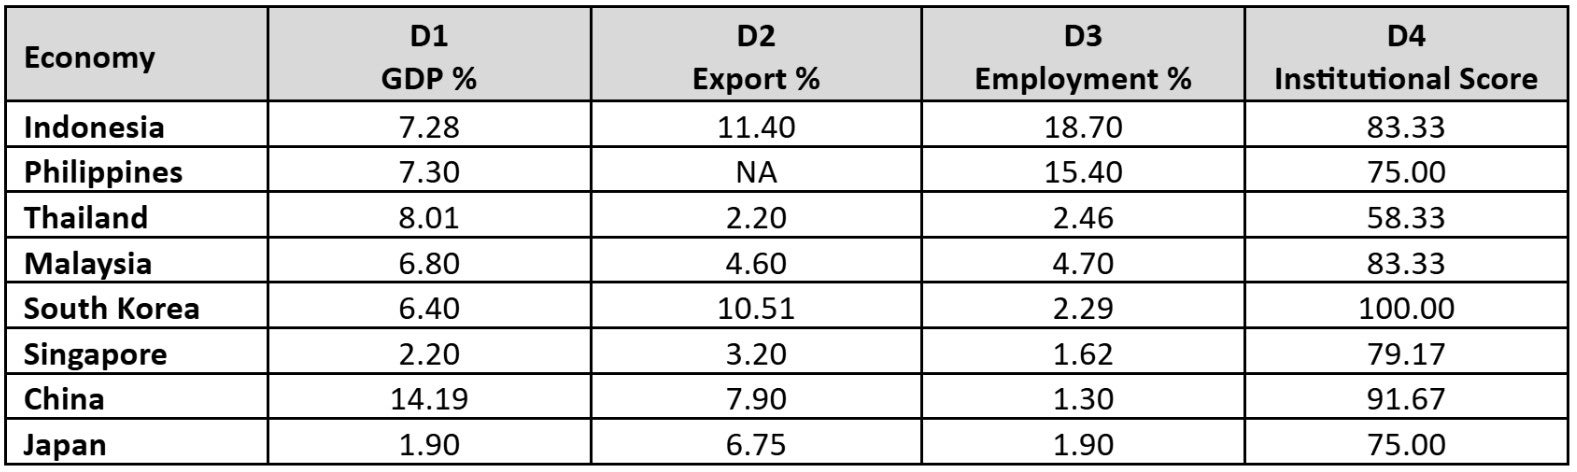
Source: Authors’ compilation from primary sources. The details are provided in Annex 2.
Note: D1, D2 and D3 represent computed proportions. D4 is indexed to 100. Methodological and Data details are in Annex 1. NA: Not available.
- China is the only economy with D1 higher than 10 per cent, reflecting a significantly large proportion of the creative economy to the overall economy. Thailand, which has the highest share of the creative economy in its GDP among economies from Southeast Asia, is similar to China in having proportionally lower shares of the creative sector in exports and employment. Malaysia resembles Thailand and China in this respect. All other economies show greater significance of creative economies in exports and employment vis-à-vis shares in GDP.
- Indonesia and South Korea have export intensities of more than 10 per cent. Within both economies, though, there’s a marked contrast. For Indonesia, high D2 accompanied by high D3 suggests a strong positive correlation between exports and employment. Such correlation is unseen for South Korea as also for Japan, China and Singapore.
- Absence of positive correlation between export and employment in most economies underscores a structural dichotomy between economies where the creative economy accounts for large employment, vis-à-vis those where it contributes much more to exports. The difference calls for policy interventions in line with the specific contribution of the sector.
- South Korea and China are among the highest in institutional capacities, followed by Indonesia and Malaysia. The results, however, do not indicate any causality between the economic parameters (DI, D2 and D3) and institutional strength (D4). South Korea’s strong institutional capacities do not imply a proportionally larger share of the creative economy in overall GDP, whereas for Thailand, it’s the reverse. Indonesia, however, could be a statistical outlier in this regard.
Some key structural learnings follow from the above. Creative economies tend to display exogenous growth. Since they’re deeply rooted in local cultures, traditions and habits which engage communities extensively, they flourish through local ecosystems. Pre-existing institutions are not necessary conditions for the growth of creative economies. The Philippines’ moderate score on institutions, for example, has not prevented its creative economy from becoming a large employment provider.
Once creative economies grow, institutions become crucial in shaping their progress. However, countries should invest in institutions depending on specific prospects of creative economies they wish to prioritise. Korea’s dedicated institutional capacities[4] have been geared towards expanding its high-value cultural exports and not towards greater domestic employment. The latter, ostensibly, is not a critical policy goal for an industrially mature OECD economy like Korea. Exports are a key creative economy focus for China, too.
While not directly influencing the creative economy’s output, institutions are essential for providing a direction to the strategic development of creative economies. They are also the platforms for policy manifestation. Countries with currently low institutional capacities and significant domestic economic presence of the creative economy, such as Thailand, can benefit from specific capacities like satellite accounts for better tracking and understanding of the domestic creative economy. Even economies with relatively higher institutional capacities, such as Singapore, Japan and the Philippines, which have dedicated statistical frameworks for the creative economy can help in a better understanding of the sector. Indeed, economies which score high on institutional capacities should focus on closer alignment of their data frameworks with global standards for better interoperability.[5]
Section 2: Four Development Pathways
Based on the results of Table 1, we identify and illustrate four different development pathways for the creative economy. These are for Indonesia, South Korea, Malaysia and Singapore.
Indonesia: The Scale Pathway
Indonesia’s high D3 score (Table 1) suggests nearly one in every five workers is employed in creative industries, highlighting the sector’s significance as a provider of livelihoods. The Indonesian creative economy’s employment absorption is far higher than that of India, Australia, South Korea and Turkey[6] and underscores its deep embeddedness in the domestic economy and society spanning several creative subsectors (such as culinary arts, fashion, crafts, performing arts and digital creative industries).[7] The high employment generation also suggests that, along with professional skills, the creative sector absorbs output from households and formal and informal enterprises, cutting across urban and rural geographies, including both traditional cultural products and modern digital content. It’s remarkable that the province of West Java alone employs more than 6 million creative workers, larger than the aggregate creative workforces of South Korea, Singapore, and Malaysia.[8]
Indonesia’s D2 score (Table 1) further highlights the sectors’ ability to generate significant exports – a feature unique to Indonesia – as most economies in Table 2 display a lack of correlation between creative exports and employment. Robust exports of craft goods, fashion and digital content[9] have encouraged growth of complementing national institutional capacities through the establishment of the Ministry of Creative Economy, which separates creative economy governance from tourism and aspires to be one of the largest creative economies by 2045.[10] The absence of a dedicated statistical framework to track various layers of a creative economy, is, however, a major institutional limitation. The 2026 National Creative Economy Census is expected to significantly improve the availability of sub-sectoral statistics, enabling targeted policy intervention.
Achieving scale in Indonesia’s creative economy is not a challenge, as considerable scale already exists. The bigger challenge is modernising and enhancing value by transforming a predominantly labour-intensive, low-value-added production (examples: craft goods, traditional food preparation, informal performing arts) sector to a more niche, intellectual property (IP) intensive, higher-value activity one (digital content, gaming, branded fashion, architecture), without displacing workers. Formalising traditional outputs through productivity-enhancing tools (examples: e-commerce access, digital payments, design training) and introducing new export facilitation measures can help and should be complemented by new-generation content production capacities in Animation, Visual Effects, Gaming, Comics and Extended Reality (AVGC) and stronger IP rules, given the greater role of artificial intelligence (AI) in generating digital content.
South Korea: The IP-Depth Pathway
South Korea’s hard focus on institutions is evident from the coordination between the Ministry of Culture, Sports and Tourism (MCST), the Korea Creative Content Agency (KOCCA), the Bank of Korea’s IP trade statistics system and the national statistical platform (KOSIS). The synergistic integration represents a highly sophisticated multi-agency creative economy governance architecture.
This institutional depth has led to the growth of an IP-driven, export-intensive creative economy. The Korean Wave (Hallyu) is more than an organic cultural phenomenon. It’s a product of decades of policy investment in cultural content production, international promotion and IP commercialisation, anchored by KOCCA’s mandate to develop and export Korean cultural content across music, film, television, gaming and webtoons. The national creative economy has a relatively small workforce (Table 1) but generates exceptional export value.[11] The fact that the creative sector contributes more than six per cent of GDP but employs a much lesser proportion of the workforce underpins the high productivity of creative labour. This is a consequence of the IP-intensity driven by the Hallyu wave.[12] The creative economy’s value is created by a few and distributed to many.
The IP-focused industrial policy does, on the other hand, raise the concern of sustaining a creative economy built on concentrated excellence. Can concentrated excellence turn to concentrated risk? Can the conditions that produced BTS (K-pop), Squid Game (K-series), and PUBG Battleground/Maplestory (game) be reliably reproduced for creative sectors not related to content and IP? Addressing the concerns will require the institutional capacity for exporting formal cultural content to be flexible enough for supporting the informal creative ecosystem comprising independent artists, micro-studios and regional cultural producers.
Malaysia: The Measurement Pathway
Malaysia’s Department of Statistics (DOSM) published the inaugural Satellite Cultural and Creative Account in December 2025, aligned to the UNESCO Framework for Cultural Statistics and independently validated against national accounts data.[13] This is a pioneering effort in the Association of Southeast Asian Nations (ASEAN) and transforms Malaysia’s creative economy policy environment. Verified and internationally standardised data on various parameters of a creative economy can now be accessed from a single authoritative source.
In terms of contribution to GDP, Malaysia’s creative sector is broadly comparable with Indonesia and the Philippines (Table 1). Its D2 and D3 scores (Table 1) point to a stable creative sector with a notable contribution to the macro-economy. This understanding has much to do with the satellite account and measurement effort. The policy emphasis on statistical measurement connects to a proactive institutional architecture reporting to the cabinet. Different ministries have been provided dedicated budgets for creating an economy, indicating the effort to decentralise.
Malaysia’s satellite account helps in obtaining deeper insights into various aspects of the performance of the sector. However, there’s still a considerable distance to travel before the sector achieves export or employment contributions close to those of other peer economies from Southeast Asia. Nevertheless, Malaysia is a front-runner among ASEAN economies in making available credible and timely statistics on the sector, enabling evidence-based research for policymaking.
Singapore: The Hub Architecture
Singapore’s creative economy scores look modest compared with most other economies in Table 1. These scores must be contextualised for Singapore’s structural economic features and policy choices.
Singapore is a city-state of six-plus million people[14] with a per capita GDP exceeding US$90,000 (S$116,744.40).[15] It does not need a creative economy to generate full employment or accelerate economic growth. Rather, it has chosen to utilise its comparative advantage of growing into a regional hub for the creative economy by embedding creative capabilities in financial services design, healthcare user experience, smart city infrastructure, media and advertising and digital platform services.
Like in other areas of focused public policy, for the creative economy too, Singapore has a whole-of-government approach entailing close integration between the Ministry of Culture, Community and Youth (MCCY) on art and cultural policy; the Ministry of Trade and Industry (MTI) on the creative economy’s trade and investment; the Economic Development Board (EDB) to showcase commercial potential of creative industries and the Infocomm Media Development Authority to regulate the digital media and creative technology sector. The low D3 score (Table 1) masks the concentration of creative economy specialists – design strategists, UX researchers and creative directors across various enterprises. The Singaporean creative economy is strategically ‘small’ – due to the embedding of creative energy and efforts in several other industries.
The deliberate policy choice of being a hub architecture stems from Singapore’s distinct characteristics of being a regional hub, and corporate headquarters for several manufacturing and service industries, including refining, pharmaceuticals, semiconductors, advanced electronics, logistics, healthcare, finance, information technology (IT), digital technology and education. Being a regional hub for a creative economy is part of Singapore’s strategic efforts to be a regional economic and business hub. The whole-of-government approach aims to secure this objective.
Section 3: Special Case Study – India
In many respects, a creative economy is a ‘natural’ sector for India given its global reputation for art, culture and varied creative outputs.
Official statistics on the country’s creative economy, encompassing media and entertainment (M&E), animation and visual effects, gaming, live cultural experiences, and digital content platforms[16], show M&E estimated at an economic size of ₹2.5 trillion (S$34 billion) in 2024, with digital media being the largest segment, with M&E ahead of television. Other estimates also suggest India’s M&E sector is one of Asia’s most dynamic, powered by digital advertising.[17] A broader definition of a creative economy extending beyond the M&E industry finds the sector contributing around 8 per cent of national employment and a fifth of gross value added.[18]
Compared with regional economies analysed earlier (Table 1), India’s creative economy is the largest in its share of the overall economy, surpassing even China. Definitional scope and statistical measurement issues exist given that more than 60 million micro, small and medium enterprise[19] operate across various sectors, including artisanal handicrafts, fashion design, digital animation and traditional performing arts. India does not yet have an official satellite account to measure various parameters of a creative economy, and the need for one can hardly be overstated.
India exhibits traits of various regional pathways identified earlier through specific geographies, sectors and institutional contexts. For example, Maharashtra’s Animation, Visual Effects, Gaming, Comics and Extended Reality (AVGC-XR) sector[20] resembles elements of South Korea’s IP-depth model. Similarly, the spatial location of several of the country’s top creative districts (refer to Annex 3 for the list) resonates with the decentralised Indonesian scale pathway. More resonance arises from the shared craft-economy heritage given both India and Indonesia’s traditions of artisanal textile production, performing arts and food as cultural expression.
Malaysia’s measurement-first aspiration mirrors what India’s Ministry of Statistics and Programme Implementation (MOSPI) would need to build. Singapore’s whole-of-government hub institutional approach, though, is yet to manifest in India through appropriate frameworks demonstrating central-state coordination. With respect to both Malaysia and Singapore, India’s English-language digital content ecosystem and AVGC services provide strong complementarity –capable of yielding enormous collaborative potential from India’s animation workforce of around 260,000 skilled professionals serving global studios with a significant cost advantage compared with Western markets.[21]
Synergies also exist with the Philippines. India’s nearly half a billion social media users[22] can collaborate effectively with the Philippines’ creator economy on content, platforms and digital distribution infrastructure. Furthermore, the India-Korea AVGC collaboration framework, as well as the India-Japan Creative Corridor, announced at the WAVES 2025 summit in Mumbai[23], are powerful creative economy partnerships.
States by Creative Economy Potential
We identify the following states in India as those with the most significant and diverse creative economy potential.
Table 2: Top Indian States and Key Locations by Creative Economy Potential
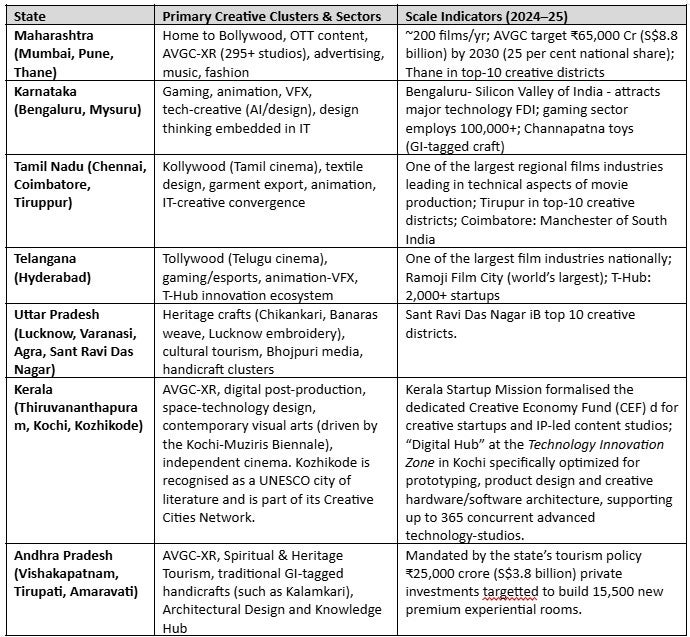
Source: Compiled by Authors from various sources including IBEF M&E 2025 and ADB/ICRIER Creative India 2022. For specific states – 1. Maharashtra – Maharashtra AVGC-XR Policy 2025. 2. Karnataka – EY New frontiers.
Navigating the evolving landscape for online gaming in India December 2023 report. 3. Tamil Nadu – ADB Creative India 2024; Tirupur Exporters Association 2024. 4. Telangana – GSDP data 2024-25; T-Hub annual report 2024. 5. Uttar Pradesh – Ministry of Textiles India 2024; 6. Kerala – GDP data 2024-25 Kerala Economic Review 2025; Kerala Startup Mission (KSUM). 7. Andhra Pradesh – Economic Survey of Andhra Pradesh 2025-16; Andhra Pradesh Tourism Policy 2024-2029 – Andhra Pradesh Industrial Infrastructure Corporation (APIIC)
Conclusion
Regional creative economies are on structurally different paths shaped by different initial conditions, policy choices and scope of definitions. The distinct regional pathways identified in this paper — Indonesia’s scale model, South Korea’s IP depth model, Malaysia’s measurement-led approach, and Singapore’s deliberate hub architecture — are distinct strategic responses to developing national creative economies, shaped by local conditions and capacities.
India already has creative economies functioning across its regions and states. Coordinated policies drawn based on Asia-Pacific experiences can significantly enhance the contribution of the creative sector to the national economy. At a time when India is striving to balance high economic growth with shrinking employment opportunities, a creative economy can fuse traditional skills and enterprises with digital advances and processes to produce equitable outcomes.
. . . . .
Dr Amitendu Palit is a Senior Research Fellow and Research Lead (Trade and Economics) at the Institute of South Asian Studies (ISAS), an autonomous research institute at the National University of Singapore (NUS). He can be contacted at isasap@nus.edu.sg. Ms Divya Murali is a Research Associate at the same institute. She can be contacted at divya.m@nus.edu.sg. The authors bear full responsibility for the facts cited and opinions expressed in this paper.
[1] UNESCO, UNDP, “The creative economy report 2013: Widening local development pathways”, UNESCO/UNDP, 2013, https://unesdoc.unesco.org/ark:/48223/pf0000224698.
[2] “New Economics for Sustainable Development: Creative Economy”, UN Economist Network; https://www.un.org/sites/un2.un.org/files/orange_economy_14_march.pdf ; Trade and the creative economy database repository of UNCTAD; https://unctad.org/topic/trade-analysis/creative-economy ; Cultural and Creative Economy Satellite Account, Policy Monitoring Platform, UNESCO; https://www.unesco.org/creativity/en/policy-monitoring-platform/cultural-and-creative-economy-satellite-account.
[3] The UN guidelines on measuring creative economies is not uniform across the region. For instance, Indonesia includes culinary arts in its definition, while Thailand includes traditional medicine.
[4] Korea’s sophisticated multi-agency institutional architecture for the creative economy includes the Ministry of Culture, Sports and Tourism (MCST); Korea Creative Content Agency (KOCCA); and IP trade statistics provided by the Bank of Korea and the national Korean Statistical Information Service (KOSIS) built for tracking, measuring and promoting a specific model of the creative economy: high-value cultural content exports.
[5] China’s creative economy statistics reflect revenues and Korea’s only services. Alignment with international reporting standards should see these being reported as Gross Value Added for China and goods and services for Korea.
[6] Prateek Kukreja, Havishaye Puri, Dil Bahadur Rahut, “India’s Creative Economy: Definition and Measurement”, Springer Books, in: Bhabani Shankar Nayak (ed.), Intimate Capitalism, chapter 0, pp. 93-151, 2024, Springer.
[7] Catherine Jewell, “Leveraging Indonesia’s creative economy”, WIPO, 1 October 2019, https://www.wipo.int/en/web/wipo-magazine/articles/leveraging-indonesias-creative-economy-40992.
[8] “BPS: Creative Economy Employs 27.4 Million Workers in 2025”, BPS-Statistics Indonesia, 17 November 2025, https://www.bps.go.id/en/news/2025/11/17/805/bps–creative-economy-employs-27-4-million-workers-in-2025.html. (To note, definitions differ across these figures.)
[9] “Indonesia’s creative economy generates $94 billion, 26 million jobs”, ANTARA News ,6 November 2025, https://en.antaranews.com/news/390361/indonesias-creative-economy-generates-94-billion-26-million-jobs.
[10] “Development potential of international trade in creative services”, Presentation by Directorate of Trade, Industry, Commodity, and Intellectual Property, Ministry of Foreign Affairs of Indonesia, 11th Session Multi-Year Expert Meeting on Trade, Services and Development, UNCTAD, Geneva, 12 July 2024, https://unctad.org/system/files/non-official-document/tsd_present_fifth_international_trade_nurdianto_en.pdf.
[11] High exports (Table 1) represent cultural content exports as a proportion of total services exports. Taken as a proportion of goods and services exports, the share will be less.
[12] IP-intensive creative content such as those of Korean-pop (K-Pop) groups generate streaming royalties, merchandise revenues and tourist inflows on a scale far larger than per capita engagement of artists and production staff directly employed.
[13] “Cultural and creative industries accounted for 6.8% of Malaysia’s 2024 GDP”, 18 December 2025, The Star; https://www.thestar.com.my/lifestyle/culture/2025/12/18/cultural-and-creative-industries-accounted-for-68-of-malaysias-2024-gdp.
[14] Population statistics as given by the Government of Singapore; https://www.population.gov.sg/our-population/population-trends/overall-population/.
[15] GDP Per Capita (current US$) – Singapore, World Bank; https://data.worldbank.org/indicator/NY.GDP.PCAP.CD?locations=SG.
[16] “Creative Industries as Growth Engines: Media, Entertainment, AVGC, Gaming and the Orange Economy”, PIB, 16 February 2026, https://www.pib.gov.in/PressReleasePage.aspx?PRID=2228572®=3&lang=1.
[17] “Stories, scale and impact: Unlocking India’s media and entertainment economy”, FICCI-EY, 5 March 2026, https://www.ey.com/content/dam/ey-unified-site/ey-com/en-in/insights/media-entertainment/2026/03/ey-stories-scale-and-impact-un-locking-indias-media-and-entertainment-economy.pdf.
[18] Kukreja, P., H. Puri, and D. B. Rahut, 2022”, Creative India: Tapping the Full Potential”, ADBI Working Paper 1352, Tokyo: Asian Development Bank Institute.
[19] Tanu M. Goyal, Prateek Kukreja, Mansi Kedia, “MSMEs Go Digital: Leveraging Technology to Sustain during the Covid-19 Crisis”, ICRIER, 2022, https://icrier.org/pdf/MSMEs_Go_Digital.pdf.
[20] The AVGC-XR sector has reportedly almost 300 studios scoping annual turnover of USD 7.7 billion (INR 65000 crore) by 2030. Sonu Shrivastava, “Maharashtra Government Approves Policy to Boost Digital Content Sector”, Deccan Chronicle,17 September 2025, https://www.deccanchronicle.com/nation/maharashtra-government-approves-policy-to-boost-digital-content-sector-1904214.
[21] “India has emerged as global creative powerhouse due to top talent, tech: EY”, The Economic Times ,4 May 2025, https://economictimes.indiatimes.com/industry/media/entertainment/india-has-emerged-as-global-creative-powerhouse-due-to-top-talent-tech-ey/articleshow/120857950.cms?from=mdr#google_vignette.
[22] “The State of Digital Marketing in India 2025-26”, DigiPlus Fest, Ipsos report, September 2025, https://www.ipsos.com/sites/default/files/ct/publication/documents/2025-09/ET%20Brand%20Equity%20Ipsos%20The%20State%20of%20Digital%20Marketing%20in%20India%202025.pdf.
[23] “India Hosts the WAVES 2025; Over 90 Countries Participate in the Pioneering Initiative of Ministry of Information and Broadcasting”, PIB, 31 December 2025, https://www.pib.gov.in/PressReleasePage.aspx?PRID=2209982®=3&lang=1.
Annexures
Annex 1: Institutional Strength Scores
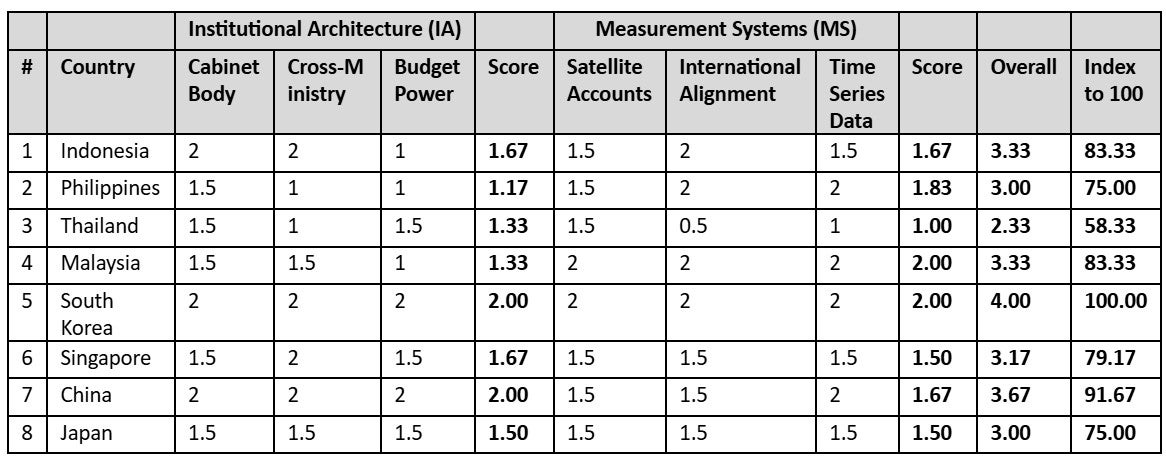
Source: Authors’ computation.
Annex 2: Data Compilation Notes for Various Economies
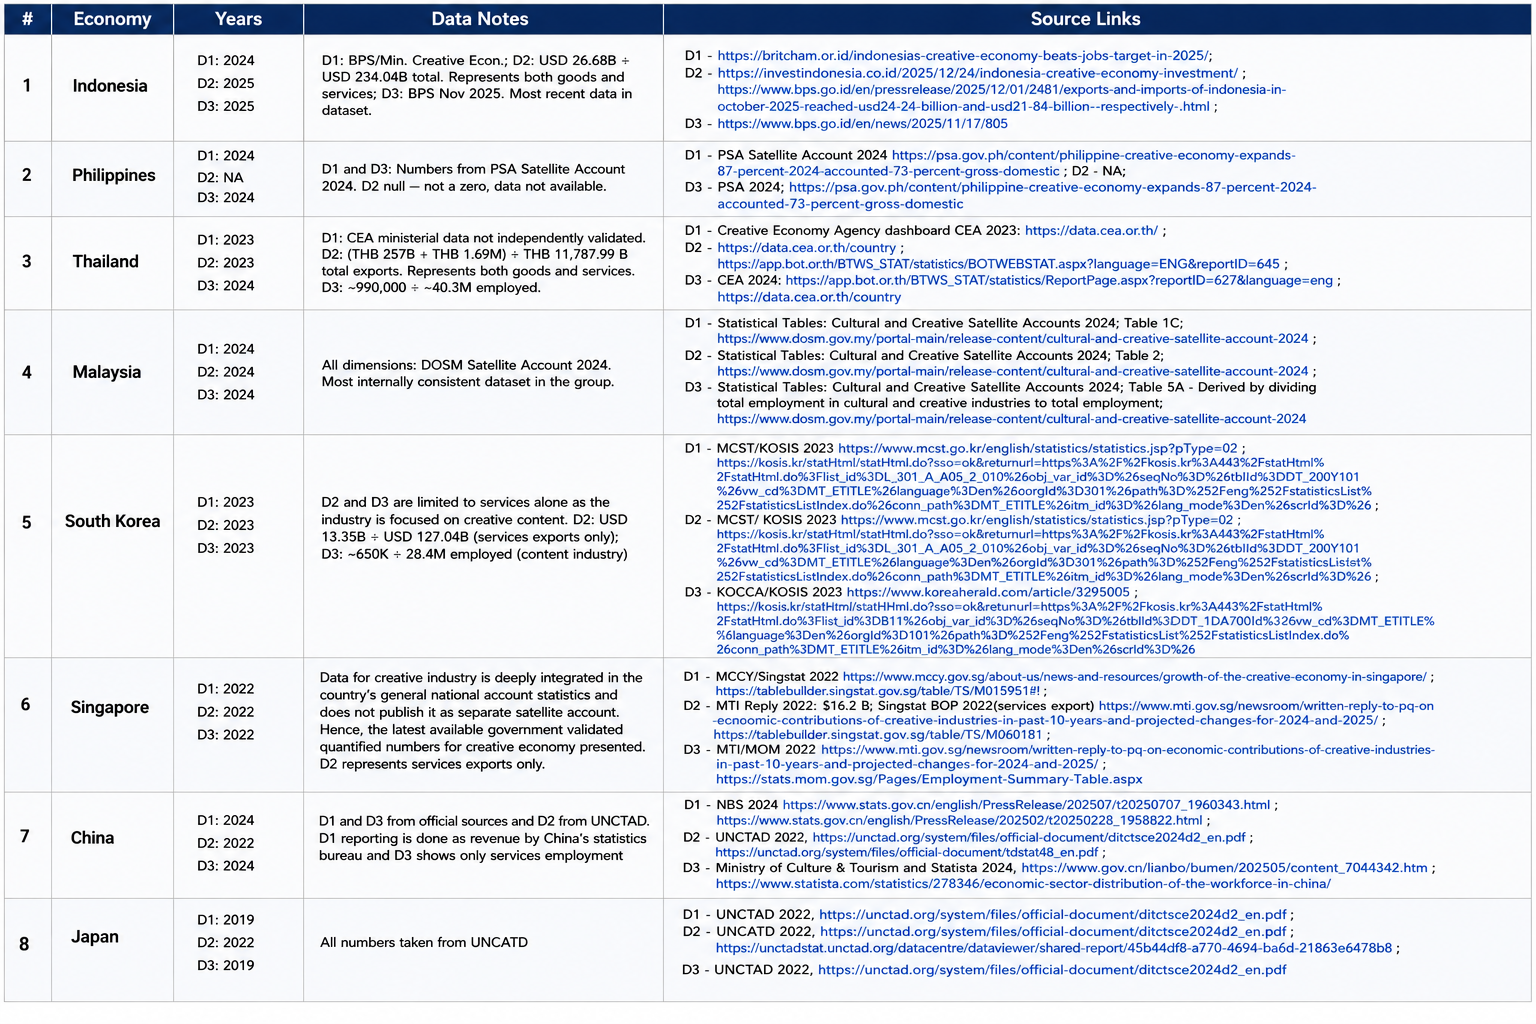
Source: Authors’ compilation from primary sources. All source links given below per economy. NA – Not Available.
Annex 3: Top 10 Creative Districts in India by Employment Measures
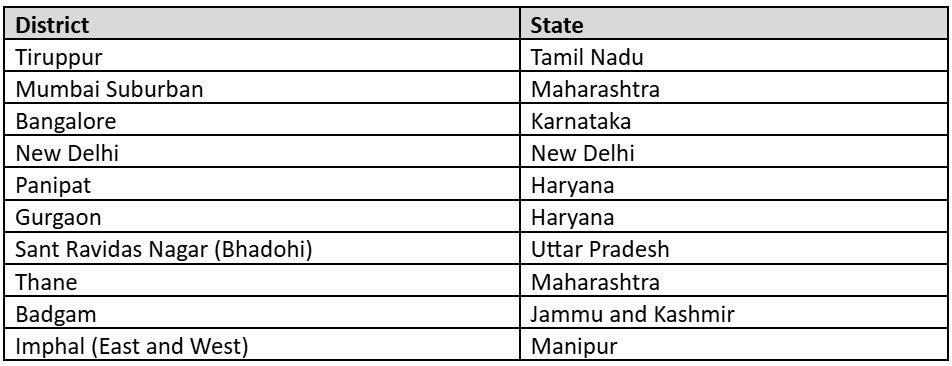
Source: “Table 2: Top 10 Districts by Location Quotient of Creative Employment across India”, Kukreja, P., H. Puri, and D. B. Rahut. 2022. Creative India: Tapping the Full Potential. ADBI Working Paper 1352. Tokyo: Asian Development Bank Institute.
Pic Credit: Chatgpt
-
 More From :
-
 Tags :
-
 Download PDF