

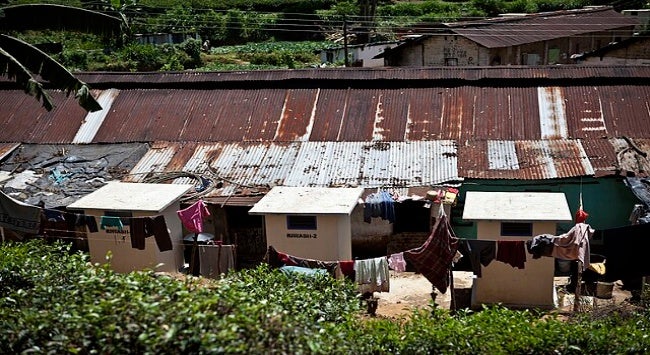
Poor Sanitary Infrastructure and the Plight of Low-Income Urban Dwellers Across Sri Lanka
Tilak Abeysinghe, Rasani Sonali Jayalath, Nethmini Gunarathna
8 May 2025Summary
Urbanisation has provided numerous opportunities to improve the livelihood of many people in Sri Lanka. However, it has also concealed the living struggle of the urban low-income people. This study analyses the economic impact of the deficiencies in drainage, wastewater and sanitation management systems on urban lower-middle-income populations across all districts, focusing on waterborne diseases, flooding-induced financial setbacks, and sanitation challenges. The findings reveal that poor drainage leads to recurrent flooding, resulting in substantial workday losses and increased healthcare expenses. A district-wise analysis highlights region-specific challenges such as significant drainage deficiencies in Matale and Kandy, and severe water quality issues in Nuwara Eliya, Puttalam and Matale. Despite significant government spending on drainage and sanitation, many communities report persistent inefficiencies, public dissatisfaction and governance issues. Computations based on a loss index indicate that long-term reduction in medical expenditures (both private and public) far outweighs the initial costs of infrastructure development to improve sanitary conditions. The importance of this preventive healthcare measure should not be underestimated.
Introduction
Rapid urbanisation in Sri Lanka has accompanied both economic growth and major challenges. Besides the better opportunities urbanisation has brought to the community, it has also elevated sanitation, flooding and public health issues. Inefficient solid waste management, unreliable water supply, inadequate drainage systems and wastewater management systems have created hazardous living conditions for urban vulnerable communities.
Some studies elsewhere have explored how poor sanitation leads to health burdens, but there is limited research that explores how inadequate sanitary facilities lead to economic hardships, especially among the urban lower-middle-income people in Sri Lanka. The main objective of this research is to investigate and understand the economic impact of these challenges on urban lower-middle-income people in the country. The study focuses on direct and indirect economic costs experienced by these people due to inadequate sanitary infrastructure and water quality. These costs are manifold and manifest as undue healthcare expenditures, workday losses, property damage due to flooding and expenses that have to be endured in seeking alternative water resources. In addition, the study explores how these challenges are linked to inefficient government budget allocations when addressing the issues of the public and climate-induced environmental shifts.
Literature Review
Although research studies on the issues concerned are lacking in Sri Lanka, there are some studies conducted in other countries that are informative. Odigie (2014),[2] based on a case study on the Ikpoba River in Benin City, Nigeria, highlights how toxic material substances in wastewater can affect water quality and human health. Water contamination from sanitary waste, process waste, wash waste, cooling and heating processes, slaughterhouse and abattoir discharges can lead to a high level of pollutants in river waters.
Lubad and Alfarra (2004)[3] discuss the health impact of poor wastewater management in the Gaza Strip, obviously before its present war-ravaged state. They point out that the Gaza Strip relies solely on groundwater for drinking and agricultural purposes. They note that 70-80 per cent of the domestic wastewater is released into the environment without treatment, and the Gaza city plant releases effluents into the Mediterranean Sea. They observe a strong correlation between high nitrate levels in drinking water in the Khan Younis area in Gaza and the blue baby syndrome.
Akpor and Muchie (2011)[4] and Aleruchi et al. (2021)[5] discuss the related health issues in detail. Untreated wastewater has significant environmental and health consequences for both humans and animals. Untreated wastewater carries bacteria, viruses, and protozoa that can cause severe long-term health conditions, including degenerative heart disease and stomach ulcers. Viruses, which are highly resistant to medical treatments and difficult to detect, pose a particular threat. The authors list a range of less severe and severe diseases resulting from pathogens in wastewater.
Health issues can have shock effects on household economic outcomes, involving health expenditures, labour supply disruptions, reduced income and consumption. This also leads to coping mechanisms such as borrowing, asset depletion and intra-household labour substitutions. The expenses of a household rise significantly when the main breadwinner experiences illnesses, especially prolonged illnesses. Yilma et al. (2021)[6] point out that annual health expenditure due to poor sanitary conditions increases substantially in Ethiopia, depending on the severity of the illness.
Methodology
Methodology of the Survey
The study commenced with the identification of key partners who would play a crucial role in facilitating data collection and ensuring the research objectives were met. These partners, comprising relevant governmental and non-governmental stakeholders, were thoroughly briefed on the study’s scope, objectives, and expectations. During this initial stage, discussions were held to align on the methodology, ethical considerations, and the importance of obtaining accurate and reliable data. This collaborative approach ensured that all stakeholders had a comprehensive understanding of their roles in the study.
Following the briefing, partners conducted a preliminary screening in collaboration with government officials. This screening process involved analysing existing data from relevant authorities, including health and municipal records, to identify locations with the highest prevalence of non-communicable diseases and significant water and sanitation challenges. Special attention was given to areas where communities faced extreme poverty and lived in substandard housing conditions. These conditions included inadequate roofing, limited access to clean drinking water, and poor sanitation facilities, which are known to exacerbate health risks. By leveraging government data, the research team ensured that the study targeted the most vulnerable populations, making the findings more impactful and relevant.
Once the high-risk locations were identified, data collection was carried out by trained researchers. Each researcher was thoroughly trained in ethical data collection practices, ensuring that interactions with participants were conducted sensitively and respectfully. The survey process was designed to take approximately 30 to 45 minutes per respondent. To obtain a comprehensive understanding of the household’s economic status, income-related questions were asked indirectly. Instead of directly inquiring about earnings, researchers engaged participants in conversations about their household conditions, expenditures, and financial constraints. This approach created a more comfortable environment for respondents, reducing potential discomfort and ensuring more accurate responses. The survey covered various aspects, including household demographics, health conditions, access to sanitation, and water quality.
A structured survey was conducted during the period November 2024 to January 2025, targeting roughly 50 households from each district. This approach resulted in a total sample size of 1,329 households, ensuring a representative dataset that could yield significant insights. The sampling framework was designed to focus on urban lower-middle-income communities, as these groups are often disproportionately affected by waterborne diseases and poor sanitation. To identify suitable locations, consultations were held with urban and municipal councils. These authorities provided data on areas with the highest reported cases of waterborne diseases, enabling the research team to strategically select survey sites.
Further, areas with a high density of conglomerated housing were prioritised, as such settlements often experience inadequate sanitation and drainage infrastructure. The selection of households was guided by income thresholds defined by the Department of Census and Statistics (DCS). Specifically, the study used the Household Income and Expenditure Report (2010) of DCS, which indicates that lower-income households earn less than LKR26,931 (S$122) per month. This income criterion ensured that the study focused on economically disadvantaged populations, providing insights into their unique challenges.
In addition to income levels, environmental and infrastructural factors played a crucial role in household selection. Households situated near open canals or drains, particularly those frequently affected by flooding, were prioritised, as these conditions increase exposure to waterborne diseases. Furthermore, housing structures were assessed, with priority given to homes built with temporary or low-quality materials, as they often lack adequate protection against environmental hazards. This multifaceted approach allowed for a more holistic assessment of the intersection between income, infrastructure, and public health risks.
Beyond household-level data collection, the study also gathered information on public sector investments in sanitation, water supply, drainage management, and wastewater management. This data was obtained through consultations with government officials in the accounting departments of municipal and urban councils. By examining budget allocations and expenditure records, the study aimed to assess the effectiveness of past and ongoing projects. These financial records were cross-referenced with public feedback and survey data to evaluate whether governmental initiatives had successfully addressed critical issues in targeted communities.
Methodology of the Loss Index
Districts can easily be compared by computing relevant index scores. Within the context of the present exercise, the relevant index is a loss index.
The loss index was computed by utilising answers to 11 survey questions. Of these, eight questions (13, 14, 16, 19, 20, 21, 25 and 30) relate to the quality (perceived or actual) of water, drainage, and sanitation conditions. If a question provides four answers, they were assigned values 1, 2, 3 or 4 such that one represents ‘no quality issue’ and four represents the ‘worst quality’. The remaining three questions capture the ‘workdays lost’, ‘school days lost’ and ‘income lost for medical expenses resulting from water-related health issues’. The underlying issue with workdays lost is the income loss. Therefore, income loss results from both workdays lost and medical expenses due to poor sanitary conditions. All the answers refer to outcomes within the last 12 months from the survey date. The frequency distribution of responses for each question in each district (275 frequency distributions in total) was compiled, and the district averages were obtained. These averages are the basic indicator variables.
To convert the indicator variables to unit-free scores, the min-max transformation was used. This is an adaptation of the methodology used by the World Economic Forum (2019)[7] in computing the World Competitiveness Index.
For a given indicator variable and a district, the transformed score is:
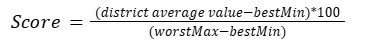
The transformed scores vary between zero and 100, with zero indicating the best outcome (no loss) and 100 the worst outcome (highest loss).
For the quality-related variables, the best minimum (bestMin) is set to the minimum value of the variable and the worst maximum (worstMax) is set to the maximum value of the variable. The simple average score of these eight transformed indicators constitutes the quality index of sanitary conditions (the lower the score, the higher the quality).
For the other three key variables, workdays lost, school days lost, and income lost for medical expenses, the bestMin was set to zero. Although this is a commonly acceptable best minimum, choosing the worstMax is an issue. The frequency distributions of these three variables across the 25 districts show that Gampaha and Kalutara are the worst performers. Based on these observations and using the highest frequency of responses in Gampaha district, the worstMax was set to 15 for workdays lost (three work weeks), 10 for school days lost (two school weeks), and LKR20,000 (S$91) for medical expenditure. Although the choice of these limits alters the index values, the ranking of districts remains largely unaffected by the magnitude of these numbers. The overall loss index is the simple average of the quality index and the above three indices.
Results and Discussion
The following sections provide a summary of the survey results. In a detailed study report, the key observations are presented for each district.
Employment Status
As the focus of the study is on urban lower-middle-income people, it is important to understand their employment status. As Figure 1 indicates, the majority of the respondents (34 per cent) are engaged in small-scale businesses such as running a small grocery shop or preparing and selling food. The second highest category, surprisingly, is the unemployed group (33 per cent). The third majority of the respondents (20 per cent) are engaged in daily paid jobs such as labouring, picking tea leaves, tailoring, and fishing.
Figure 1: Employment status
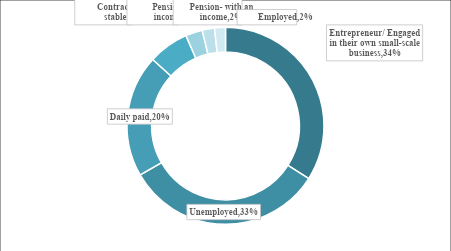
Source: Authors’ computations based on survey data
Water Quality
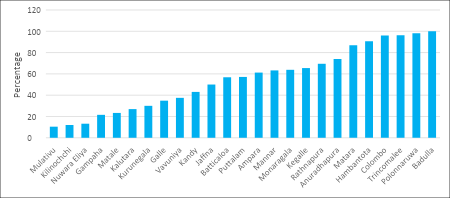
Figure 2 shows a measure of water quality in each district as perceived by the respondents. It shows the percentage of people who think their readily available water is safe for consumption. Nuwara Eliya stands out as the worst case, with all the respondents saying that they do not assume their drinking sources are safe. Even the highest-ranking districts are below the 100 per cent mark. This highlights the plight of the low-income urban dwellers; their very basic essential life source is far from optimal.
Figure 2: Water quality for consumption
Source: Authors’ computations based on survey data
Tap Water Usage
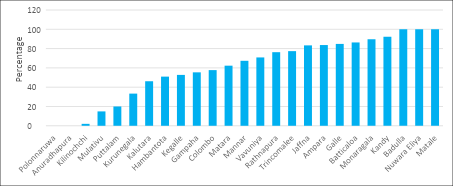
Figure 3 depicts the percentage of households that use tap water as their drinking source. Mullaitivu, Kilinochchi, Nuwara Eliya and even Gampaha are among the lowest users of tap water. Besides tap water, responding households utilise other drinking sources such as boreholes, well water, river water, and fountain water. Six districts at the right end of the chart show tap water usage above 80 per cent.
Figure 3: Tap water usage
Source: Authors’ computations based on survey data
Drainage Issues
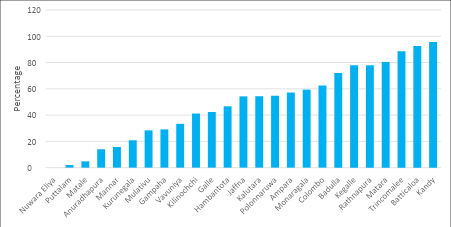
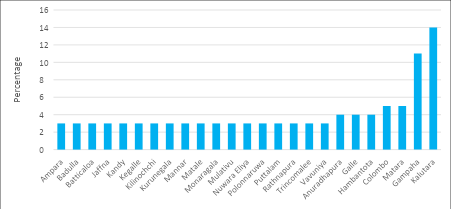
Figure 4 shows reported drainage issues, mostly resulting from clogged and overflowing drainage during rainy seasons. Matale, Nuwara Eliya and Badulla record the highest percentage of drainage maintenance issues. Polonnaruwa, Anuradhapura and Kilinochchi record the lowest percentages. What is surprising is that the districts in the dry zone, such as Hambantota, Mannar, Vavuniya, Trincomalee, Jaffna, Ampara and Batticaloa, also report drainage issues.
Figure 4: Drainage issues (Percentage of total quantified responses)
Source: Authors’ computations based on survey data
Workdays Lost
Figure 5 shows the average workdays lost as a result of waterborne diseases and flooding. Kalutara recorded the highest, followed by Gampaha. The lowest average is three days; many districts report this average. Even in these districts, there is a large variation in the workdays lost, with few respondents recording much higher numbers than three, signifying a substantial loss in income.
Figure 5: Average workdays lost
Source: Authors’ computations based on survey data
Medical Expenditure Due to Waterborne Diseases and Flooding
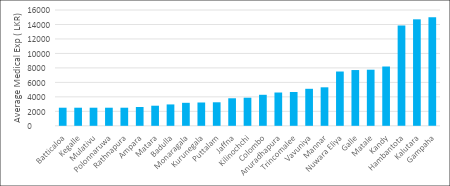
Figure 6 highlights the average medical expenses that the urban lower-middle-income people have to endure due to waterborne diseases and flooding. As the chart describes, Gampaha reports the highest average of LKR15,000 (S$68), followed by Kalutara with LKR14,712 (S$67). It is surprising to notice that despite being a dry zone district, Hambantota reports the third-largest average of LKR13,846 (S$63). Other dry zone districts with unexpectedly high average medical expenditures are Jaffna, Anuradhapura, Trincomalee, Vavuniya, and Mannar. The lowest average works out to be LKR2,500 (S$11); Batticaloa, Kegalle, Mullaitivu, Polonnaruwa, and Rathnapura are in this group.
Although the average is low, there are reported cases with medical expenditure exceeding LKR50,000 (S$227). It should be noted that these are private medical expenses and do not account for medical expenses borne by government hospitals.
Figure 6: Average medical expenditure
Source: Authors’ computations based on survey data
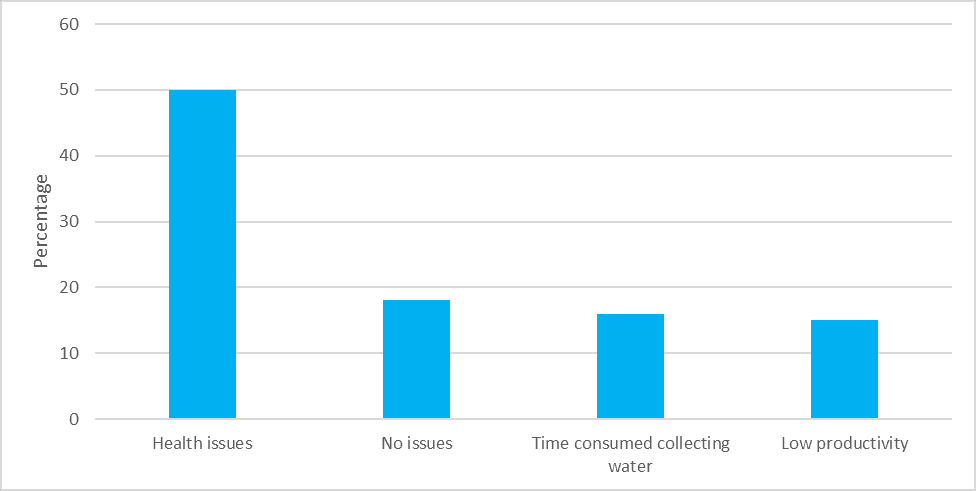
Impact of the Deficiency of Consumable Water and Sanitary Facilities on Women
Figure 7 demonstrates how the lack of sanitary facilities and consumable water affects women in these households in the whole sample. The majority of the respondents mentioned that they experience health issues due to the deficiencies of pure water and sanitary facilities. A sizeable number also indicate that women have to spend more time fetching water due to a lack of consumable water and interruptions in the water supply. As a result, a sizeable portion of women have lost their productive activities.
Figure 7: Impact of water interruption on women
Source: Authors’ computations based on survey data
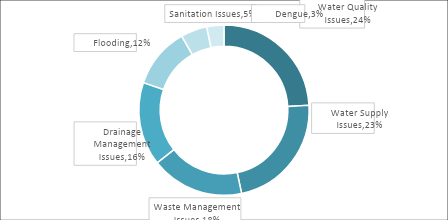
Issues Expressed by the Respondents
The pie chart in Figure 8 presents the issues reported by the respondents in the whole sample concerning water and sanitation. The most pressing concern relates to water quality (24 per cent) and water supply issues (23 per cent). Waste management and drainage management issues rank as the third and fourth most frequently reported concerns, respectively. Although the percentage reporting flooding issues is 11 per cent, in some districts, flooding is a major concern.
Figure 8: Key issues across all the districts
Source: Authors’ computations based on survey data
Substantial budget allocations occur in most of the districts to address the issues of wastewater management, water supply and quality management, drainage issues, flooding and landslides, and communicable diseases. However, inefficiencies in fund management have resulted in the problems persisting year after year. For brevity, we do not list out these budget allocations, which are available in a longer report that can be obtained from the authors.
Key Observations from District-level Analysis
The individual district analysis reveals some important aspects of the impact of inefficient water supply and sanitary facilities that urban lower-middle-income households have been living with. The key observations are summarised below.
- The employment status of this group of people shows that a large majority are engaged in small businesses like running a grocery shop or preparing and selling food in the neighbourhood. Some work as daily paid labourers or three-wheel drivers. A substantial majority are also unemployed, perhaps depending on government handouts. Undue medical expenses resulting from waterborne diseases and workday losses impose an unbearable burden on them. Economic cost is both direct and indirect.
- Water quality and water supply interruptions are the most predominant issues across the districts. The water supply often gets disrupted, leaving people hours without the main water supply. They have to look for alternatives such as walking long distances to fetch water, thereby losing work hours. At times, they may end up drinking low-quality water, leading to severe health complications.
- Drainage issues, even in the dry zone districts, are surprising. Flooding occurs not just because of the inadequate drainage system but also because of the improper handling of solid waste. It was reported that Batticaloa, Jaffna, Trincomalee, Vavuniya, Mullaitivu and Kilinochchi encounter flooding incidents even during the slightest rainfall because their drainage systems are cluttered with waste. Waste is not collected on a regular schedule, and garbage gets stagnant in the drainage. Municipal and Pradeshiya Sabha workers expect the residents to tip them for collecting the garbage. Uncollected garbage gets thrown in waterways and on roadsides because the waste management mechanism is not executed properly. All this happens despite substantial budget allocations for the maintenance of the drainage system.
- Many urban lower-middle-income people live in conglomerated houses, which are mostly situated near a lake, a canal or a stream. These canals get dumped with domestic wastewater and garbage from some of these houses. Leaving these canals unattended and dirty provides a breeding ground for multiple diseases. Moreover, conglomerate houses do not have proper drainage systems, and during the rainy seasons, these areas get frequently flooded as there is no proper mechanism to drain the collected water.
- Kegalle district reports a very low number of water supply and water quality complaints because the lower-middle-income areas were covered by a water supply project by the municipal authority. Kegalle stands as an example to showcase how the installation of a proper water supply can improve the quality of life of low-income people.
Loss Index
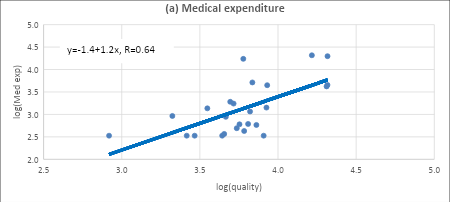
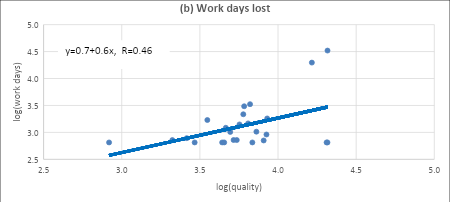
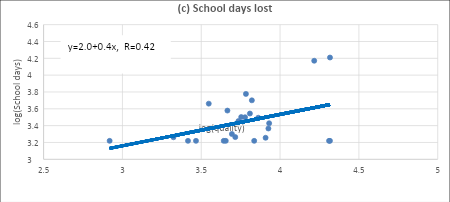
District-level information from this study can be placed on a comparative footing by examining the loss indices. Table 2 provides the overall loss index and its component indices with district ranks. Note again that the reference units are the urban areas of the districts. Figure 9 provides a graphical presentation of the quality of sanitary conditions as a predictor of the other three indices. The key observations from these computations are the following:
- Every district is some distance away from the best outcome of zero loss. In other words, lower-middle-income households in every district suffer from poor drainage and water systems.
- Gampaha and Kalutara are the worst-performing districts with the highest loss scores, though they are well below the worst outcome of 100. Other districts are below the midpoint of 50.
- The quality index is a reasonably good predictor of medical expenditure, with a statistically significant relationship. One per cent drop in quality increases medical expenditure by 1.2 per cent. In other words, one per cent improvement in the quality of sanitary conditions reduces medical expenditure by 1.2 per cent. This entails strong policy implications that will be discussed in the concluding section.
- The predictive power of quality for workdays lost and school days lost is somewhat lower, but the relationship is statistically significant. One per cent drop in quality increases workdays lost by 0.6 per cent and school days lost by 0.4 per cent. (The predictive power of the quality index highlights the quality of the survey data.)
- As expected, a drop in quality leads to substantial variations in medical expenditures, workdays lost, and school days lost across districts (note the rising spread of the scatter plots).
- District ranking further highlights the poor drainage and water management systems of the worst-performing districts. The correlation between the ranks of the overall index and the quality index is 0.83.
Table 2: Loss index
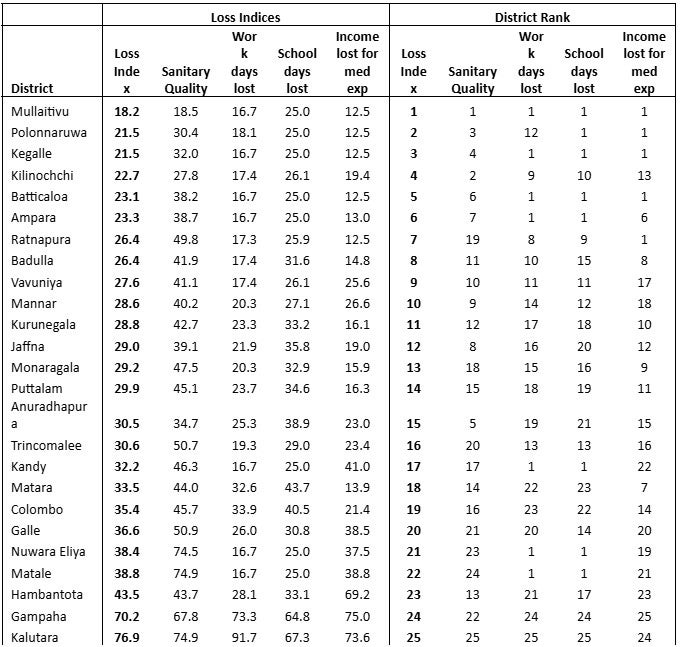
Source: Authors’ computations based on survey data
Note: Loss index range 0-100, with zero indicating best outcome and 100 worst outcomes.
Figure 9: Sanitary quality as a predictor of medical expenditure, workdays lost and school days lost
Source: Authors’ computations based on survey data
Recommendations
One major finding of the study is the prevalence of waterborne diseases such as dengue, diarrhoea, gastrointestinal infections, and dermatological infections. These health issues are often a direct consequence of stagnant and contaminated water, poor drainage, and inadequate waste management. It is observed that many urban low-income households spend a significant portion of their income on medical treatments. These are private medical expenses.
The study entails a very strong policy implication with regard to government health expenditure, though it was not covered directly by the study. The estimates based on loss indices show that a one per cent drop in the quality of sanitary conditions increases medical expenses by 1.2 per cent. In other words, one per cent improvement in sanitary conditions lowers medical expenses by 1.2 per cent. Many low-income people seek free healthcare from public hospitals, and such expenditure is not counted in the study. Public hospital medical expenditure is borne by the government (taxpayer money). If it is assumed that the above result holds for public medical expenditure as well, it implies that spending on sanitary infrastructure is more than offset by the reduction in public medical expenditure. Spending on sanitary infrastructure does not happen every year, whereas savings on public medical expenditure are cumulative. Therefore, in the long run, this preventive healthcare measure leads to a substantial reduction in public health expenditures that more than offsets the sanitary infrastructure expenditures.
More specifically, structural enhancements like increasing drainage capacity, building retention ponds, cleaning the garbage-filled lakes, routine system maintenance and regulated drainage maintenance can minimise the adverse effects of wastewater and flooding. Infrastructure development could also be coupled with government compensatory measures and livelihood support for the affected families.
The findings of this study make it undeniably clear that addressing water and sanitation challenges must be a national priority. Despite budgetary allocations, gaps in execution and systemic inefficiencies continue to exacerbate the struggles faced by urban low-income populations.
Sri Lanka stands at a critical turning point where proactive policy measures, innovative water management solutions, and citizen involvement can transform urban sustainability. By embracing a forward-thinking approach, the country can not only enhance public health outcomes but also strengthen economic resilience, ensuring a better quality of life for all.
. . . . .
Dr Tilak Abeysinghe is an Adjunct Senior Research Fellow at the Institute of South Asian Studies (ISAS), an autonomous research institute at the National University of Singapore (NUS), and a Senior Research Advisor at Marga Institute, Sri Lanka. He can be contacted at tilakabey@nus.edu.sg. Ms Nethmini Gunarathna is a researcher at Marga Institute, Sri Lanka. She can be contacted at nethminigunarathna94@gmail.com. Ms Rasani Sonali Jayalath is also a researcher at the same institute. She can be contacted at sonalirasani16@gmail.com. The authors bear full responsibility for the facts cited and opinions expressed in this paper.
[1] This study resulted from the effort of a larger research team. The project was funded by Gamani Corea Foundation and conducted by Marga Institute. Apart from the authors, the Marga team of the project include Amar Gunatilleke (Executive Vice Chairman of Marga), Fahim Aslam, Nipun Ranasinghe, Senali Aponsu and Leshanie Jayawardana. Ground-level data collecting consultants include Thiwankee Wickramasinghe, Anushka Kasthuri Arachchi, Dhananjaya Bandarage, Northwestern Small Entrepreneurs’ Development Society and Community Oriented Resource Exchange.
[2] Joyce Osarogie, Odigie, ‘Harmful effects of wastewater disposal into water bodies: A case review of the Ikpoba River, Benin City, Nigeria’, Tropical Freshwater Biology, 23( 1), 2014, pp. 87-101.
[3] Sami Lubbad and Amani Alfarra, ‘Health effect due to poor waste water in Gaza Strip’, SSRN, 2004, Online SSRN: https://ssrn.com/abstract=1457842.
[4] Oghenerobor Akpor and Mammo Muchie, ‘Environmental and public health implications of wastewater quality’, African Journal of Biotechnology, 10(13), 2011, pp. 2379-2387.
[5] Owhonka Aleruchi, Egbono Frank Fubara and Buduka Justice Otto, ‘Wastewater quality- It’s impact on the environment and human physiology: A Review’, International Journal of Advance Research and Innovation, 9(4), 2023, pp. 43-58.
[6] Zelalem Yilma et al., ‘Economic consequences of ill-health in rural Ethiopia’, Health Systems & Reform, 7(2), 2021.
[7] World Economic Forum, The Global Competitiveness Report 2019, http://www3.weforum.org/docs/WEF%5CTheGlobalCompetitivenessReport2019.pdf.
Pic Credit: Wikimedia Commons
-
 More From :
-
 Tags :
-
 Download PDF