


Economics of Free Healthcare:
The Key Trend Setters and Sustainability of Public Health Expenditure in Sri Lanka
Tilak Abeysinghe, Nethmini Gunarathna
6 September 2024Summary
The Sri Lankan welfare state that once acclaimed a name for the country is not built on financially sustainable principles. This working paper examines the economics of free public healthcare in the Sri Lankan context. It analyses the operation of ‘demand-induced supply’ in a free healthcare system in contrast to ‘supplier-induced demand’ in a market-driven healthcare system. Regression results show that the relationship between the elderly population shares and per capita public health expenditure (PHE) is weaker than expected. The death rate from non-communicable diseases is a robust predictor of PHE. Sustaining the expenditure momentum adds further pressure. As demand increases, cost pressures build up, and exogenous cost elements start to kick in, for example, the cost of medical imports. Although foreign prices of medical imports have gone up, a primary contributor to the upward trend in import cost is the secular depreciation of the Sri Lankan rupee. Projections show the possibility of continuing the past expenditure growth pattern unless substantial efforts are made to alter the demand trends. From a policy perspective, there are two aspects to consider: 1) Demand-induced cost containment; and 2) Revenue generation within the public health sector.
Introduction
Universal free healthcare has been the hallmark of the Sri Lankan public healthcare system. This has been a part of the broader agenda of the Sri Lankan welfare state that acclaimed a name for the country in the 1960s and 1970s for being a ‘good outlier’ among low-income countries. However, the Sri Lankan welfare state was not built on sustainability principles. Persistent budget deficits since 1956 financed through borrowings led to an unsustainable buildup of public debt.
Despite the curtailment of public expenditures on welfare and social services (in relative terms), the debt burden continued because inflexible social expenditures have been replaced by inflexible debt service payments.[1] The ash cover that kept the sparks from igniting for a long time was blown away by the winds of the COVID-19 pandemic and other concomitant episodes. The country was engulfed in an unprecedented economic crisis that led the Sri Lankan government to default on its public debt in May 2022.
Against this background, it is highly policy-relevant to understand the trendsetters of different public expenditure categories and figure out how to alter these trends to ensure financial sustainability. In this paper, we focus on the public healthcare sector. The main objective is to present a simple projecting model and analyse the results with some policy recommendations.
Some Literature
Population ageing and health expenditure have received considerable attention from healthcare researchers. Meijer et al. (2013) provide a critical review of many of these studies.[2] Among the subsequent studies, Marino et al. (2017) have developed a detailed panel regression model for forecasting health expenditures in OECD countries.[3] Williams et al. (2019), however, argue that population ageing may not be the primary driver of health expenditure growth.[4]
Within the Sri Lankan context, Rannan-Eliya and Associates (2007) have engaged in a detailed study on both private and public health expenditures with projections over a long-time horizon, 2005-2101.[5] Their study highlights the impact of population ageing in driving up health spending. They also emphasise the importance of cost-efficient healthcare systems and proactive measures to address the changing disease burden. They project health-expenditure shares of Gross Domestic Product (GDP). It is, however, more informative to project health expenditures and GDP separately because a small health expenditure share of GDP is not necessarily a bad thing if the GDP has grown at impressive rates to create a bigger base. Nevertheless, projecting GDP over a long-term horizon is a serious challenge. Another study by the World Bank (2008) also highlights Sri Lanka’s demographic shift towards an ageing population.[6]
Methodology
Economics of Free Healthcare
From an economics theoretic angle, we usually select predictors by looking at demand and supply determinants. For example, the price taker assumption leads to specifying either a demand or a supply function, not both. However, the process is not that clear in a free healthcare system.[7] It is well known that in a market-driven healthcare system, there is a problem of ‘supplier-induced demand’. In a free healthcare system, however, it is the other way around, it is ‘demand-induced supply’. This is not a problem though. The government’s role is more accommodating to meet the changing demand and cost conditions.
A graphical illustration is given in Figure 1 with a downward-sloping demand line (D0) and a horizontal supply line (S0), the latter to indicate demand-induced supply (perfectly elastic supply). The price (P0) is implicit because the patients do not know the exact price of the medical product (services and goods) they receive. Although the government pays this price on the patient’s behalf, it is the taxpayer who pays it indirectly. When demand shifts from D0 to D1, the price pressure builds up and exogenous cost elements start to kick in (for example, the cost of medical imports) and shift the supply line to S1 at price P1. Since the price mechanism does not operate here to curtail the demand, how much is supplied by the government, Q2 or Q1, is unknown. However, it is well known that various supply bottlenecks such as over-crowing, poor facilities, and long delays for specialist care, arise to curtail the demand below Q2.
Figure 1: An illustration of demand-supply interaction in a free healthcare system
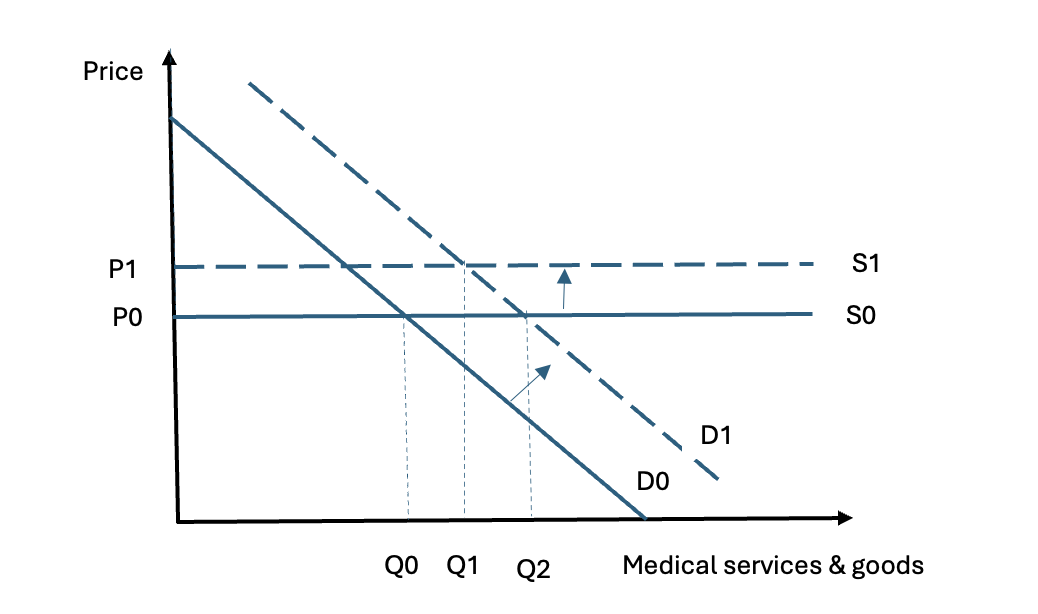
Source: Authors’ illustration
Increasing demand driving up public healthcare spending can be seen indirectly in Figure 2, which shows the employment of the public health sector as a proportion of total public sector employment. This share has increased from 1.34 per cent in 1990 to more than 5.5 per cent after 2016. Healthcare is highly labour intensive, and increasing demand cannot be easily met through automated means.
Figure 2: Public health sector employment share (%)
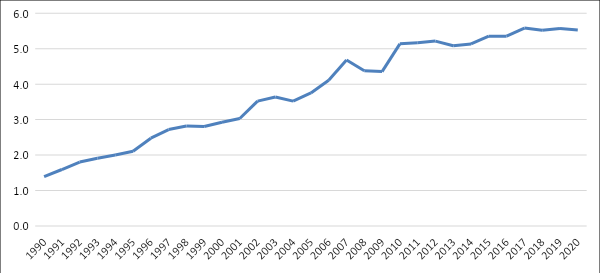
Source: Central Bank Reports
Key Predictors of Public Health Expenditure
The econometric model formulated to predict Public Health Expenditure (PHE) is a macro time series model that can easily be updated as trend patterns change.[8] The dependent variable of the regression model is per capita PHE (both recurrent and capital) in nominal terms. The lion’s share of the recurrent PHE consists of wages and maintenance costs. In addition to some exogenous drivers of these expenditures, the model should capture the continuation of the expenditure momentum.
To obtain stable parameter estimates, we experimented with several variables depending on data availability. Estimation was carried out using annual data from 1990-2019. Aberrations during the COVID-19 pandemic and the economic crisis (2020-22) have thrown some data points substantially off the trend lines.
The first key predictor, as in the other studies, is the share of the elderly population to account for the impact of population ageing. In many developed countries, the elderly population is counted from age 65 onwards. However, for this study, we used age 60+ for several reasons. First, we experimented with population shares 40-49, 50-59, 60-69, 60+, 65+ and 70+ and found that in general, their relationship with PHE is weak after controlling for other variables; the strongest is the 60+ share. The second reason can be seen in Figure 3, which presents the population shares of broad age groups that include projections till 2040. As seen in the Figure, falling fertility rates quickly translate into falling population shares of younger age groups. The age group 45-59 also starts to shrink after 2029. The age group 60+ shows a clear upward trend over the entire sample period. Third, the age 60+ shows a positive relationship with per capita PHE (Figure 4 is illustrative). Although the age group 45-59 also shows a positive relationship over the sample period 1990-2019, this is bound to change when its population share starts to decline after 2029.
Figure 3: Sri Lanka population shares (%) by age group
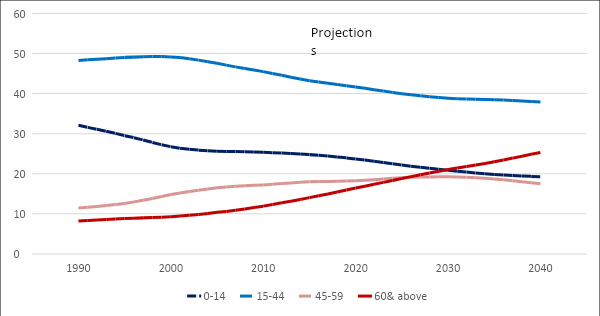
Source: Based on the UN population database.
Figure 4: Per capita PHE and population shares (log scale, sample period 1990-2029)
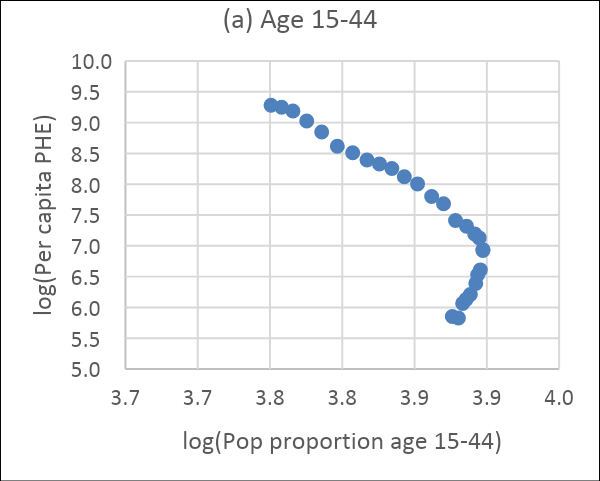
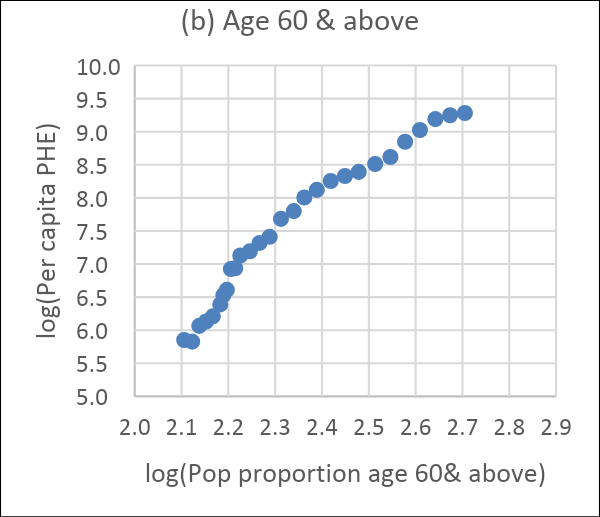
Source: Authors’ computations based on UN data
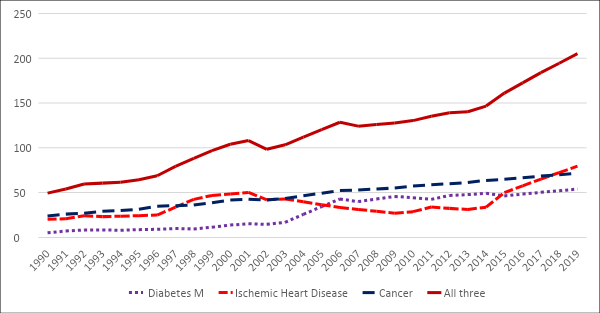
The second key predictor we consider is non-communicable diseases (NCDs). Usually, the elderly population share is used to capture the effect of age-related diseases. However, we find that NCDs are a robust predictor of health expenditure because non-elderly people also succumb to NCDs. NCDs are on the rise globally. Although the relevant variable is the incidence rate of NCDs, we found it difficult to compile the incidence data series systematically and consistently. Therefore, we use the NCD death rate (per 100,000 population) from three major killers as a proxy for the incidence rate. The three leading killers are cancer (malignant neoplasms), ischemic heart disease, and diabetes mellitus. We had to fill in some missing values through linear interpolation. We denote the sum of the death rates of these diseases as NCD3 sum.
The data plot in Figure 5 shows a steady rise in these death rates, with cancer dominating in general, but all three have moved neck and neck towards the end of the sample period. The dominance of cancer is well observed in other countries as well. The NCD3 sum shows the possibility of increasing NCDs at an increasing rate.
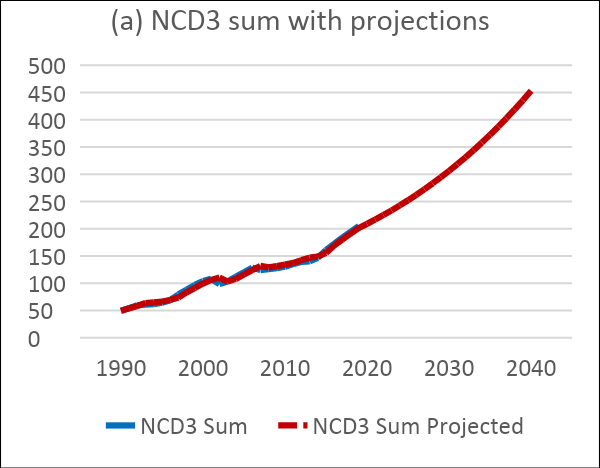
A data plot of the NCD3 sum in log form shows a linear increase. We, therefore, project the NCD3 sum by regressing the log of the variable on its lag and a time trend. The lag variable captures the momentum carried forward and the effect of some left-out variables that are autocorrelated. Figure 6(a) shows the projections made from this regression till 2040, together with actual values till 2019. The fitted values till 2019 are from a static simulation (the lagged value is the actual observation of the previous year). From 2020 onwards, the projections are from a dynamic simulation using 2019 NCD3 as the starting value. Although the projection model is simple, it fits the data very well because of the presence of a steady trend. Altering this trend is a policy concern that we will discuss later. Figure 6(b) shows a close relationship between per capita PHE and NCD3 in log form.
Figure 5: Death rates (per 100,000 population) from three NCDs
Source: Authors’ computations from Vital Statistics
Figure 6: NCD3 death rate: (a) Fitted values till 2019 and projections from 2020, (b) Relationship between NCD3 and per capita PHE

Source: Authors’ computations from Vital Statistics
An important predictor of health expenditure is a price or cost index for health services and goods. How prices change as demand forces and medical technologies change is a very informative construct. As stated earlier, although patients do not pay this price (directly), as prices increase, PHE goes up. Baumol’s cost disease is well known in health economics. In short, labour productivity in the healthcare sector is found to be lower, but, when wages increase in the rest of the economy in line with improving labour productivity, wages in the healthcare sector also increase. However, to equalise marginal productivity with real wages (nominal wages divided by price), healthcare sector prices have to increase.
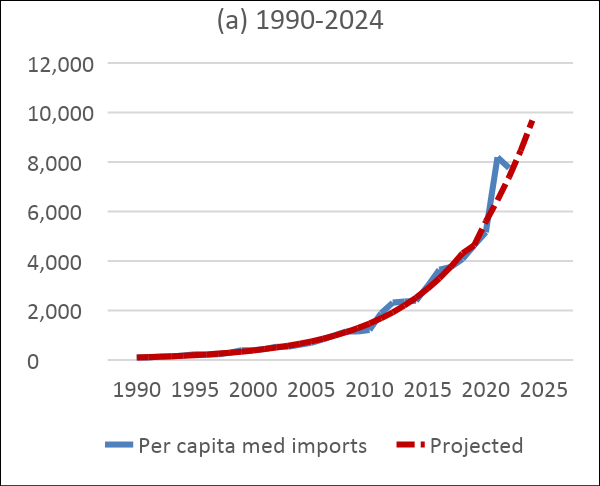
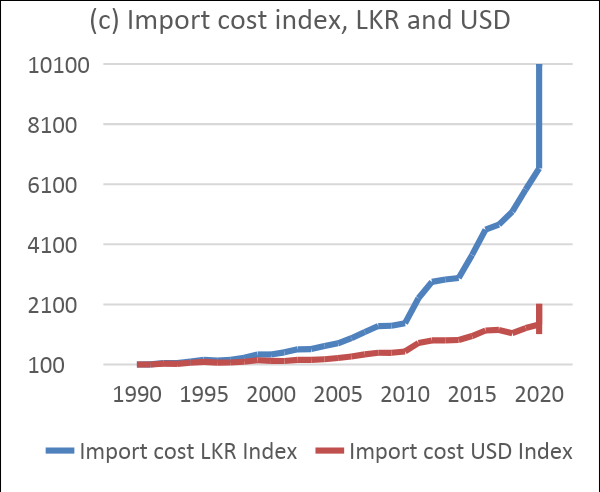
Given the data constraint, after some experimentation, we selected the per capita cost of imported medical products as the third key predictor. Domestic production of Western medical products in Sri Lanka is extremely limited, and almost all these products are imported. Although rising demand for domestic healthcare drives the demand for medical imports, as a cost indicator, the medical import cost contains exogenous elements. The import cost increases for two reasons: 1) An increase in foreign prices of imported products; and 2) Sri Lankan rupee (LKR) depreciation. This can be seen easily in Figure 7(c), which plots per capita medical import cost in LKR and United States dollars ($US) in index form. Although the medical import cost has increased in $US, the main driver of rising costs in rupees is the secular depreciation of the LKR, as can be seen by the widening gap between the two curves.
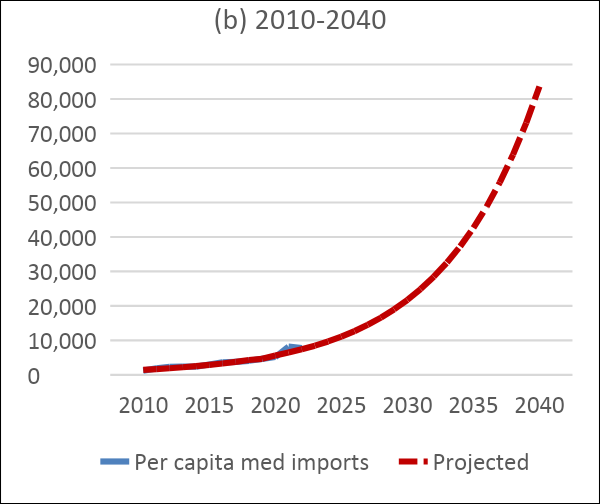
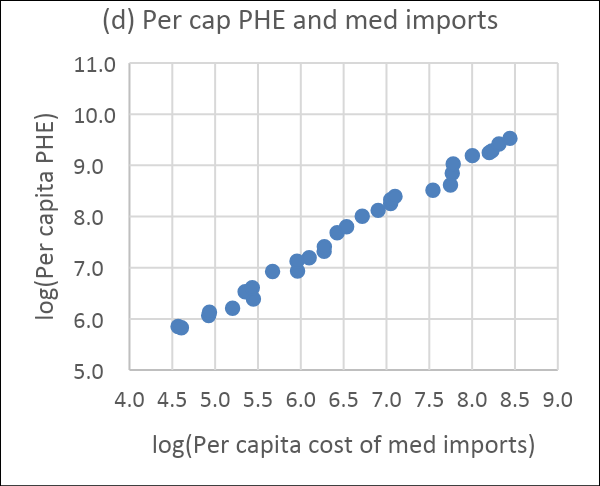
The per capita cost of medical imports in log terms has moved in a straight line. We, therefore, regress the log of the variable on its lag and a time trend to obtain projections till 2040. For a graphical highlight, actual and projected values are presented in two parts in Figure 7. Figure 7(a) shows the actual and fitted values obtained by estimating the model over the period 1990-2019. The fitted values are static simulations. The jump in medical import costs in 2020 and 2021 above the trend line is easily seen in the graph. This is a result of the COVID-19 pandemic. Figure 7(b) shows projections from 2020 (dynamic simulations). The persistence of this trend depends on healthcare policies. Figure 7(d) shows a tight relationship between per capita PHE and per capita cost of medical imports in log terms.
Figure 7: Per capita cost of medical imports: (a) Actual (in rupees) and fitted values, (b) Projections from 2020, (c) Import cost index in LKR and USD, (d) Relationship between per capita cost of medical imports and PHE
Source: Authors’ computations from Central Bank data
Another key predictor of health expenditure is personal income. Although this is a key determinant of private health expenditure, it can be ignored for PHE because public healthcare is free. If anything, the income effect on PHE could be negative because rich people tend to seek private healthcare. There are many other variables, like quality improvements with new technologies and products, that drive up PHE. We allow most of these effects and the expenditure momentum to be captured by the lagged dependent variable.
Results
The scatter plots above show a close relationship between per capita PHE and the predictors in the log scale. To make sure this is not a spurious relationship caused by the trends in the variables, it is important to formulate a cointegrating regression.[9]
The estimated regression models are of the form:
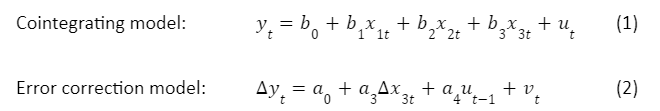
where yt = log(per capita PHE), x1t = log(population 60+ share), x2t = log(NCD3 death rate), x3t = log(per capita cost of medical imports), ut and vt are residuals. Model (2) is obtained after dropping ∆x1t and ∆x2t because of their statistically less significant coefficient estimates. The combined model is obtained by plugging (1) into (2). The parameter estimates (elasticities) are given in Table 1.
Obtaining stable parameter estimates for the elderly population share was very problematic. There are two possibilities for such a weak relationship. First, data and model specification issues. We tried different specifications, but none were satisfactory. Abeysinghe and Rajaguru (2020)[10] have shown that the nature of the non-stationarity of the regression variables is less important so long as the residuals are stationary. This is what we find with the estimates from model (1). Their Z(MA) test for an MA unit root, statistically significant adjustment coefficient a4 from model (2), and the residual-based DF test affirm the cointegration of the variables in model (1).
Second, the true relationship between elderly population shares and PHE is in fact weak as argued by some researchers cited earlier. The elderly population is only a proxy for a higher incidence of morbidity under the assumption that elderly people seek more healthcare, both inpatient and outpatient. Limited data we could find on hospitalisation episodes (Annual Health Bulletin, MOH) for the age group 70+ as a proportion of total episodes show an increase in hospitalisations from 7.9 per cent in 2004 to 12.5 per cent in 2021. It should be noted that hospitalisation episodes are less informative because they include multiple admissions of the same patient. With increasing life expectancy, repeat admissions are likely to go up. Although we cannot deny the fact that elderly people seek more healthcare, after controlling for NCDs, the population ageing effect seems to go down. Without such controls, we may overestimate the population ageing effect on health expenditures.
Table 1: Elasticity estimates (log-linear specification)
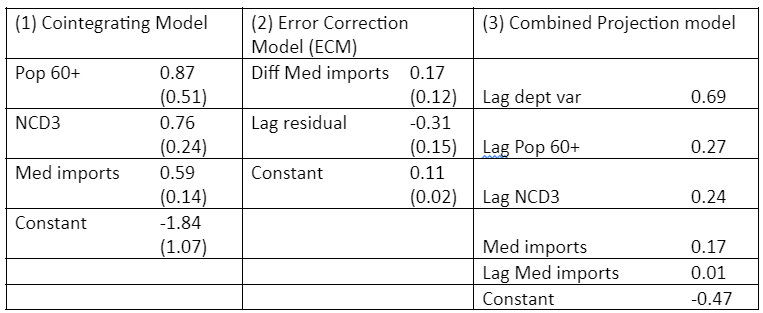
Note: All variables are in log form. Standard errors are in parentheses. Pop 60+ = Elderly population share aged 60 & above; NCD3 = Death rate from cancer, ischemic heart disease, and diabetes mellitus; Med imports = per capita cost of imported medical products. Lag=one year lag. Diff=first difference of the variable. Residuals are from the cointegrating regression (1). Residual-based Dickey-Fuller test for cointegration: t=-3.2. Estimation period 1990-2019.
Source: Authors’ computations
The elasticity estimates in Table 1 are self-explanatory, and for brevity, we will skip explaining them. However, it is worth emphasising the robust impact of NCDs on PHE. As discussed later, preventive healthcare is the only way to reduce this impact on public coffers. Medical import cost also shows a robust relationship with PHE. The government has little control over this variable. As seen in Figure 7(c) LKR appreciation will lower this import cost.
The coefficient of the lagged dependent variable (0.69 in the last column of Table 1) indicates the continuation of the expenditure momentum and to some extent the effect of other left-out variables. It is more likely to be the momentum given that recurrent PHE cannot easily be reduced.
For a better contrast, Figure 8 shows the fitted values and projected values by splitting the graph into two parts. (a) shows the actual values and the fitted values which were obtained through static simulation. The COVID-19 pandemic throwing PHE off the trend is visible in the graph. (b) shows the projected values through dynamic simulation. The graph shows the possibility of an exponential increase in per capita PHE if interventions do not occur.
Figure 8: Per capita PHE: (a) Actual and fitted, (b) Projections from 2020 (in rupees)
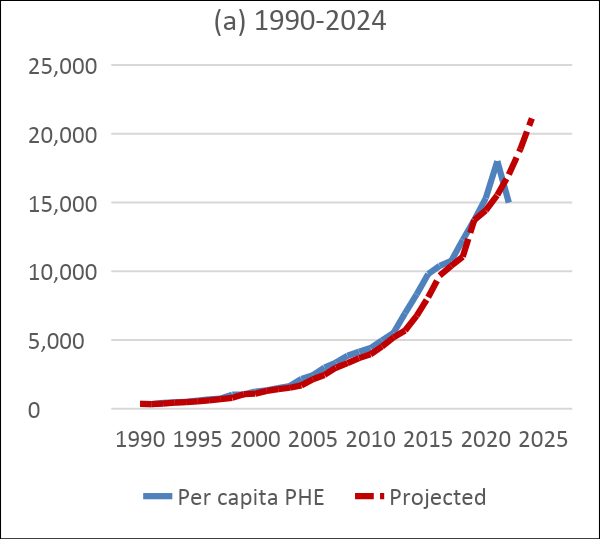
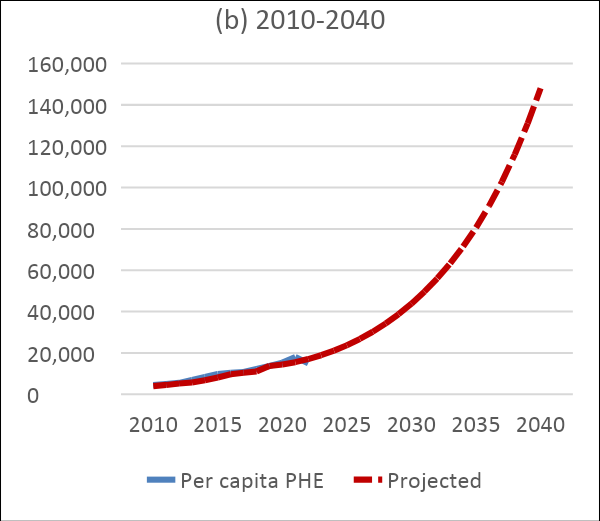
Source: Authors’ computations. Various sources including Institute for Health Policy
For a better grasp of the magnitude of the numbers, Table 2 provides both per capita and total PHE at five-year intervals. The table also shows the five-year average growth of total PHE after 1990. The growth rates fluctuated a bit before 2020 because of the capital expenditure, which is largely discretionary and lumpy. Since it is difficult to project capital expenditures, we used the total (both recurrent and capital) for modelling. The impact of this is to smoothen out the growth figures and provide roughly 13 per cent growth in the projection horizon. This increase is by no means small considering the low revenue base.
Table 2: Projected per capita and total public health expenditure
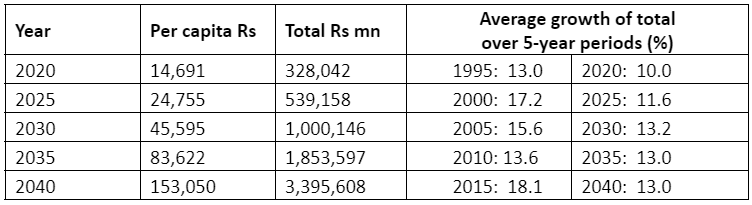
Source: Authors’ calculations
Discussion
Financial sustainability of the public health sector involves two aspects to consider: 1. Demand-induced cost containment, and 2. Revenue generation within the sector. Two key demand shifters we examined are the elderly population share and the incidence of NCDs proxied by their death rate. It is difficult to reverse the population ageing trend unless the fertility rates pick up. However, getting old does not necessarily have to be getting sick. In other words, the relationship between health expenditure and ageing depends on health. Unlike population ageing the trend of NCDs can be altered. As the adage goes ‘prevention is better than cure’; what is needed to decelerate the demand for healthcare is prevention.
Preventive Healthcare
Usually, medical professionals refer to preventive healthcare as direct interventions to provide medical services such as vaccinations. Sri Lanka has achieved a lot in this respect. However, preventive healthcare goes well beyond this. Singapore is a good example. Relatively, Singapore spends very little on healthcare directly. Household expenditure on healthcare in 2017/18 was 5.5 per cent of total household expenditure (Singapore MOH website). Government healthcare expenditure is less than 3 per cent of GDP. In contrast, OECD countries spend about 9 per cent of GDP on average; the United States alone spends about 17 per cent. Yet, Singapore excels in health outcomes.[11] Health-adjusted life expectancy in Singapore, around 74 years, is the second highest in the world (highest Japan, WHO online). The secret is preventive healthcare.
One way to assess preventive healthcare in action is to compare health-related risk behaviours among the people of different countries. The first author supervised a study by his student Yang Shu Wen[12] to examine how health-related risk behaviours changed over successive generations (birth cohorts) in four countries: Australia, the United Kingdom, Hong Kong and Singapore.
After controlling for age and income effects, the results showed that smoking in all four countries had a declining pattern over successive birth cohorts, with Hong Kong and Singapore showing steeper drops. This is not surprising given the restrictions on smoking in many countries. Interestingly, alcohol consumption does not show a systematic drop over different birth cohorts across all four countries. This is understandable because alcohol is likely to be both a tonic and a toxin.
What was most interesting were the results on physical inactivity and the lack of sufficient physical exercise within a defined period like a week. Quite often, people start to engage in physical exercise only after excessive weight gain. We need to control for this effect as well. It was interesting to observe that the downward trend of the physical inactivity index (or the increase in physical exercise) in Singapore over successive birth cohorts was not related to obesity. In contrast, an upward trend in physical inactivity levels was observed in Australia and the UK. These figures indicate that people in these countries resort to physical exercise mainly because of their over-weight problems. (Hong Kong results were not very informative.)
Many factors contribute directly and indirectly to preventive healthcare, and much can be learnt from Singapore’s preventive healthcare landscape. The most important is educating the public on self-responsibility in healthcare. In Sri Lanka, even those who get ample physical exercise from their hard labour do not seem to care much about prevention. For example, burning plastic is a common sight in both urban and rural areas. Many are not aware of the carcinogenic effects of plastic fumes. Workers who cut concrete and metals do not wear masks. Traffic police breathe polluted air without masks. Examples are many. The root causes of many chronic diseases are socio-economic.[13] Therefore, the study of social epidemiology plays a critical role in designing preventive healthcare measures.
Revenue Generation
Singapore is again a good example to learn from. As a British colony, Singapore inherited British-style free healthcare financed by general taxation. Singapore, however, deviated from this very early and established self-responsibility and medical savings account system as a corner stone in healthcare. Affordability and sustainability are the key considerations. Singapore has a thriving private healthcare sector. However, the ward-class system in public hospitals is designed to divert money from rich spenders to public hospitals. In Sri Lanka despite the perception that professional care in public hospitals is better, rich people go to private hospitals because of other amenities. While Sri Lanka retains its free healthcare system, some measures can be taken to divert some funds from private hospitals to public hospitals. Three suggestions are:
- Introduce high-quality paying wards in public hospitals,
- Establish hospital-run pharmacies within hospital premises,
- Introduce a small user fee for each patient.
Although we can elaborate on each of these points, we will leave it for policymakers to evaluate.
Conclusion
The projections of this exercise indicate that PHE is likely to grow by 13 per cent per annum over the projection horizon till 2040, which is very much like the continuation of the past. In the decade before 2020, nominal GDP has grown on average by 10.6 per cent annually, and real GDP by 5.3 per cent, with an underlying price inflation of 5.3 per cent. The PHE share of GDP was on average 1.6 per cent. If the country could come out of the post-pandemic economic crisis soon and return to these trend lines, the PHE share of GDP may increase to above 2.8 per cent by 2040. Although this is not staggeringly a large number relative to OECD countries, the past shows the difficulty of financial sustainability because of the weak public revenue side. As discussed above, self-responsibility and preventive healthcare can reduce the demand pressure on both the public and private health sectors substantially and alter the PHE trajectory considerably. Moreover, with sufficient internal revenue generation, the public health sector can be made very healthy even with a 2-3 per cent PHE share of GDP.
. . . . .
Dr Tilak Abeysinghe is an Adjunct Senior Research Fellow at at the Institute of South Asian Studies (ISAS), an autonomous research institute at the National University of Singapore (NUS), and a Senior Research Advisor at Marga Institute, Sri Lanka. He can be contacted at tilakabey@nus.edu.sg. Ms Nethmini Gunarathna is a researcher at Marga Institute, Sri Lanka. She can be contacted at nethminigunarathna94@gmail.com. The authors thank Ananda Jayawickrama and Chan Kok Hoe for their insightful comments on an earlier draft of the paper. The authors bear full responsibility for the facts cited and opinions expressed in this paper.
[1] Abeysinghe, Tilak, ‘Debt begets debt: The Sri Lankan welfare state and fiscal sustainability’, Asian Economic Journal, 35(4), 2021, pp. 363-389.
[2] De Meijer, Claudine, Bram Wouterse, Johan Polder, and Marc Koopmanschap, ‘The effect of population ageing on health expenditure growth: A critical review’, European Journal of Ageing, 10(4), 2013, pp. 353-361.
[3] Marino, Alberto, Morgan, David, Lorenzoni, Luca, and James, Chris. ‘Future Trends In Health Care Expenditure: A Modelling Framework For Cross-Country Forecasts’, OECD Health Working Paper No. 95, OECD Publishing, Paris, 2017, http://www.oecd.org/health/health-working-papers.htm.
[4] Williams, Gemma, Jonathan Cylus, Tomáš Roubal, Paul Ong, Sarah Barber, and World Health Organization, ‘Sustainable Health Financing with An Ageing Population, Will population ageing lead to uncontrolled health expenditure growth?’, 2019, World Health Organization.
[5] Rannan-Eliya, Ravindra P., ‘Population Ageing and Health Expenditure: Sri Lanka 2001-2101’, 2017, Institute for Health Policy Colombo, Sri Lanka.
[6] World Bank, ‘Sri Lanka: Addressing the Needs of an Ageing Population’, Human Development Unit, South Asian Region, Report No 43396-LK, 2008.
[7] We were not able to find any theoretical formulations on this topic.
[8] If necessary, aggregate PHE projections can be broken into components by projecting component shares.
[9] If non-stationary variables are bound by a causal relationship, a static regression in the levels of the variables renders stationary residuals. A cointegrating regression provides consistent parameter estimates even if some of the explanatory variables are endogenous.
[10] Abeysinghe, Tilak, and Rajaguru, Gulasekaran, ‘A Gaussian test for stationarity in a mixed frequency regression for more power’, Journal of Data Science, 18(4), 2020, pp. 649-663.
[11] World Health Organization, The World Health Report – Health Systems: Improving Performance, 2000; and Haseltine William, Affordable excellence: The Singapore healthcare story: how to Create and Manage Sustainable Healthcare Systems, Brookings Institution Press, 2013.
[12] Yang, Shu Wen, Individual responsibility in healthcare expenditures and healthy living, Honours Degree thesis, 2011, Department of Economics, National University of Singapore.
[13] Abeysinghe, Tilak. and Gu, Jiaying, “’tress and cancer: A link through the Chinese Cultural Revolution’, BrainImmune , April 2012, http://www.brainimmune.com/.
-
 More From :
-
 Tags :
-
 Download PDF